
Seasonalysis wordmark
The later brand system paired the chart icon with a rounded blue wordmark, giving the finance product a clearer standalone identity than the old page header.
Archive
Seasonalysis was an early iOS market-analysis app and later web platform for screening seasonal stock patterns, inspecting pattern history, saving watch lists, and sending email alerts before pattern entry and exit dates.
Original product story
The old Cyrillian products page split Seasonalysis into two surfaces: the iPhone and iPad app, and Seasonalysis.com. The app pitch was direct: enter a stock symbol and get a clear analysis of that stock's seasonal price behavior.
The web version launched on August 18, 2011. The press release described more than 7,000 stocks across major US exchanges, nearly 15 million seasonal patterns, up to 5,000 saved patterns per member, and customized email updates. The product was not a portfolio tracker. It was a screener and monitoring system for annual market cycles.
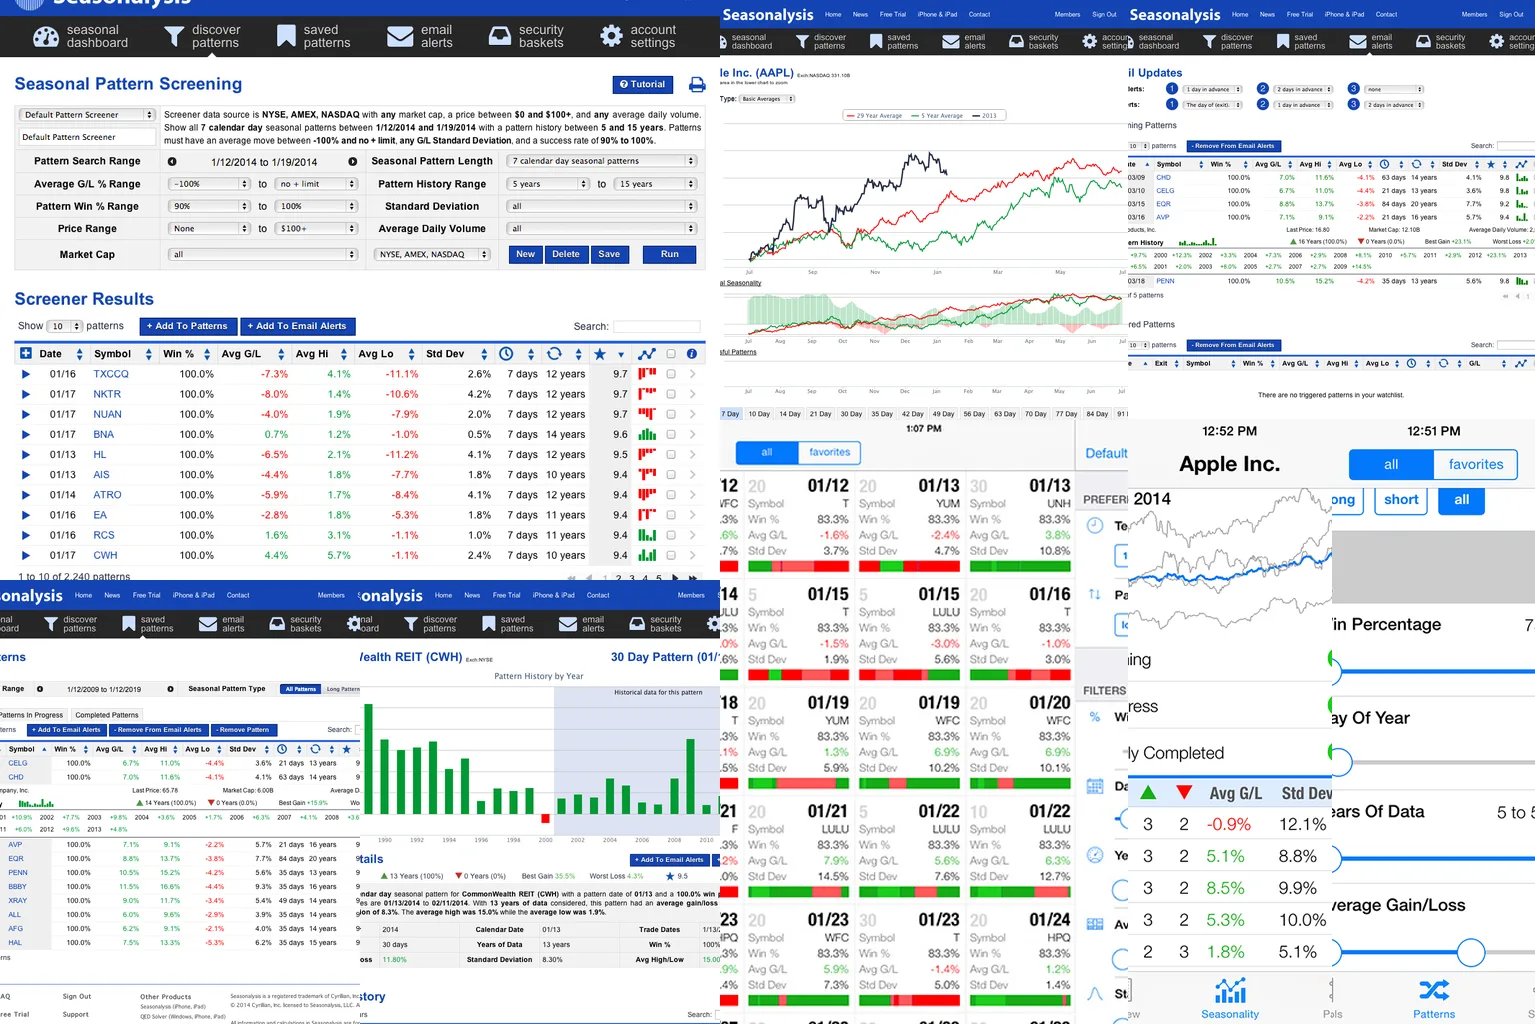
The new screenshot set makes the product shape plain: compact iPhone charts, denser iPad dashboards, web tables with sortable pattern statistics, saved pattern lists, watch lists, and alert state. Seasonalysis tried to make seasonal tendencies inspectable instead of leaving them as one-off market commentary.
Launch artifacts
The later brand system paired the chart icon with a rounded blue wordmark, giving the finance product a clearer standalone identity than the old page header.
The icon kept the product promise simple: bars, a seasonal curve, and a blue finance palette inside the rounded iOS frame.
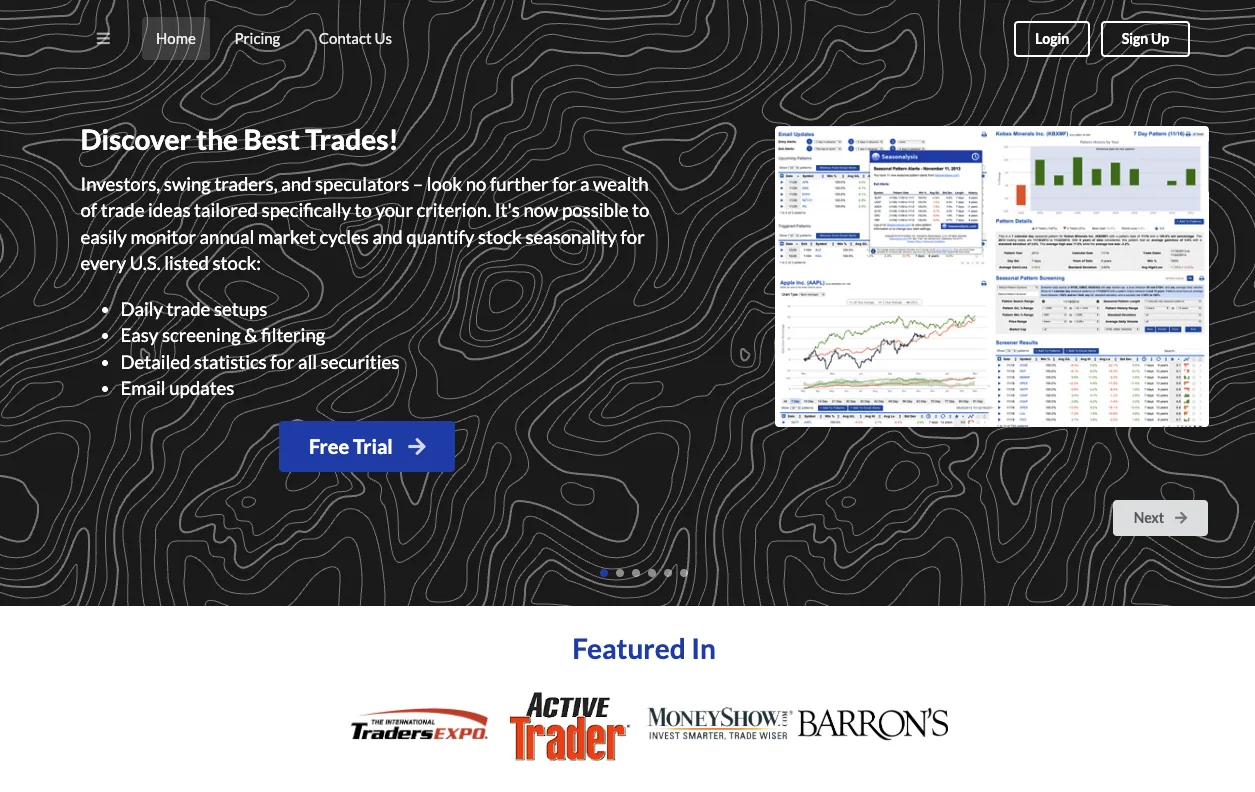
The web homepage led with trade setups, screening, detailed statistics, and email updates, with product screenshots beside the pitch and press logos below.
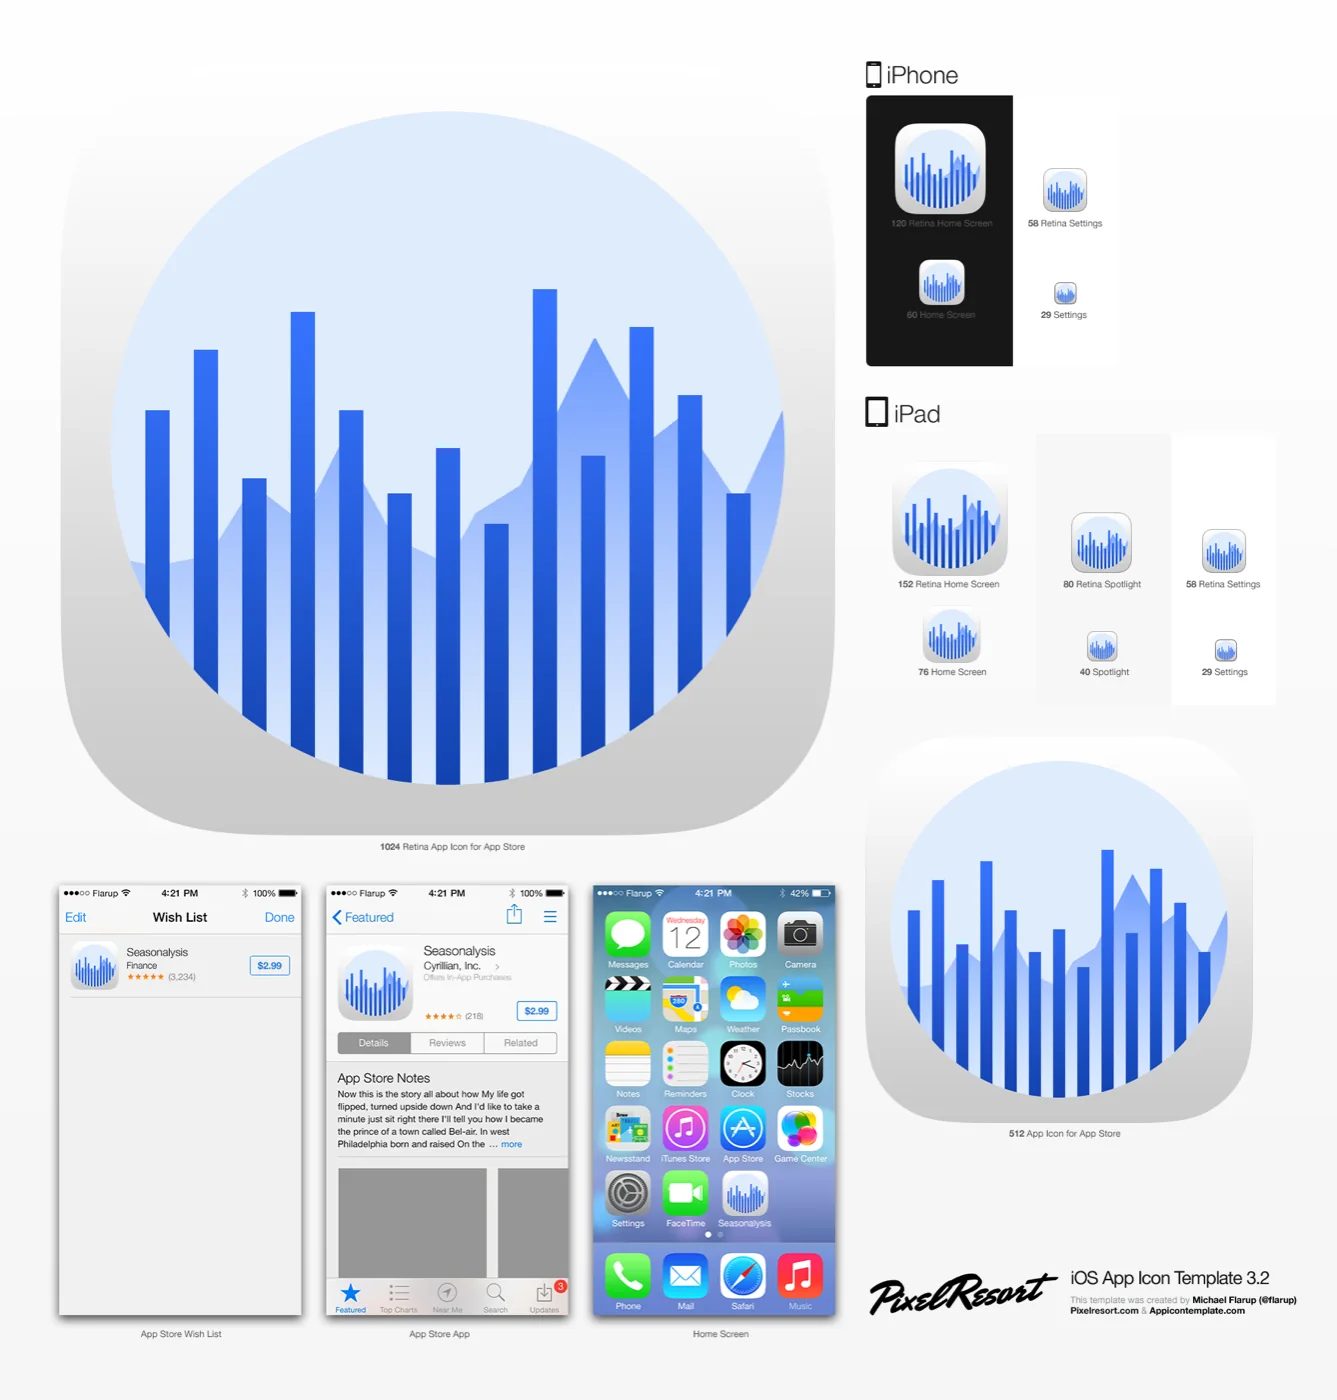
The source template preserves the 2013 App Store context: Retina sizes, settings icons, iPad variants, wish-list and store previews, and the icon sitting on an iPhone home screen.
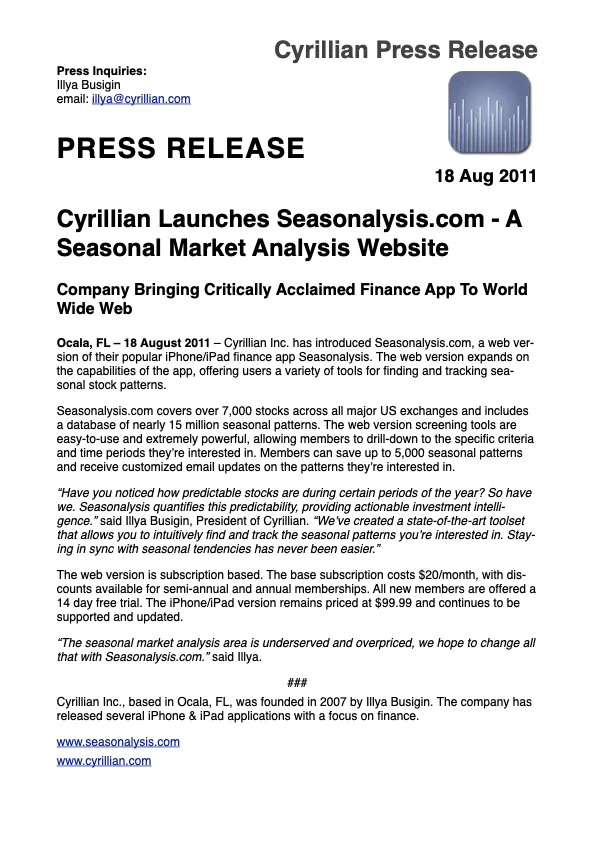
The launch release ties the web product to the iPhone and iPad app and gives concrete numbers: over 7,000 stocks, nearly 15 million patterns, and up to 5,000 saved patterns per member.
What it shipped with
The iOS app centered on ticker lookup, symbol overview charts, monthly seasonality summaries, statistics, and upcoming, in-progress, and recently completed patterns.
The screeners filtered by date range, win percentage, years of data, average gain/loss, standard deviation, seasonal window, price, market cap, and exchange coverage.
Pattern detail pages exposed win percentage, average gain/loss, average high and low, standard deviation, rating, history, and per-year performance instead of a single headline number.
Saved patterns were organized by upcoming, in-progress, and completed state. The 2011 web launch release said members could save up to 5,000 patterns and receive email alerts before pattern entry and exit dates.
Archive notes
The August 18, 2011 press release described more than 7,000 stocks across major US exchanges and nearly 15 million seasonal patterns. Later web copy described 5,000+ US stocks and detailed statistics for each pattern.
The iOS app made one symbol readable on a small screen. The web product handled discovery: saved screeners, large result tables, pattern detail pages, history tables, and account-level alert tools.
The screenshots preserve per-year history, entry and exit dates, high and low movement, gain/loss, ratings, sparklines, and filters. The product made the evidence visible before a pattern was saved or monitored.
This page preserves product history and old screenshots. It is not a live financial product, market-data service, or trading recommendation.
Screenshots
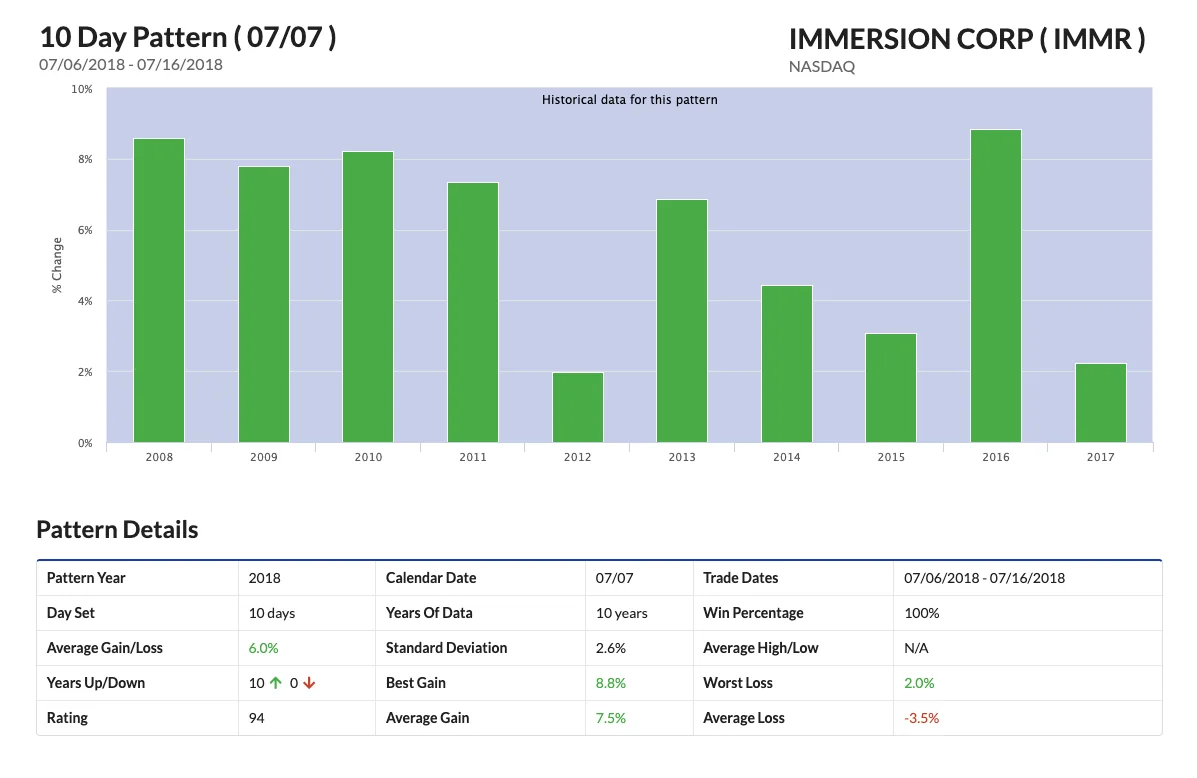
A single pattern page paired annual return bars with date range, day set, years of data, win percentage, rating, average gain/loss, high and low, and best and worst outcomes.
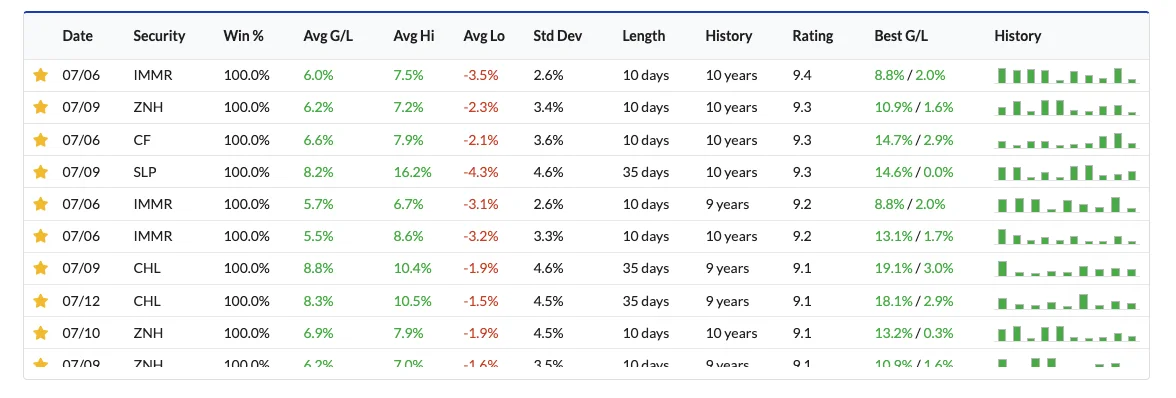
The web table put date, symbol, win percentage, average gain/loss, volatility, history, rating, best gain/loss, and tiny history bars in one scan.
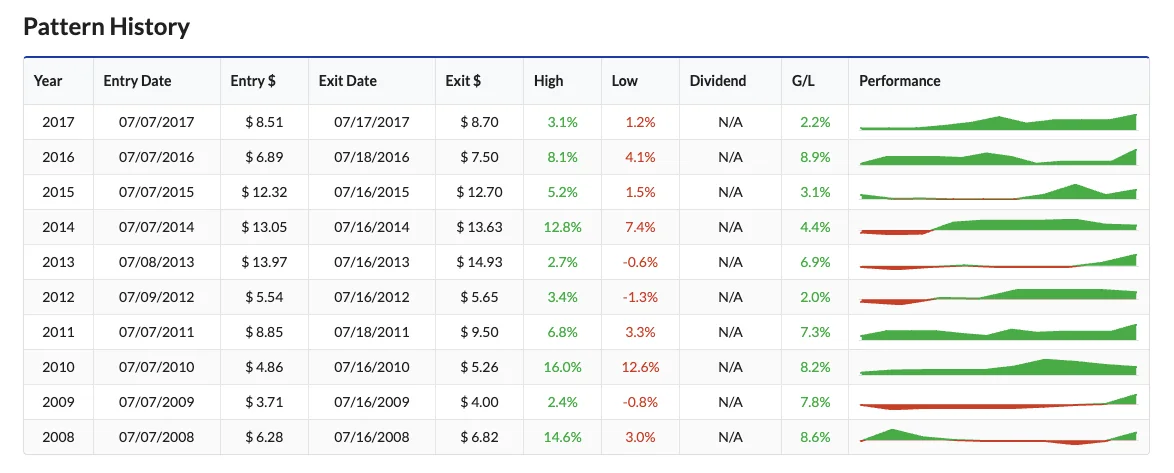
Per-year entry and exit prices, high and low movement, gain/loss, and sparklines turned a pattern into an auditable record.
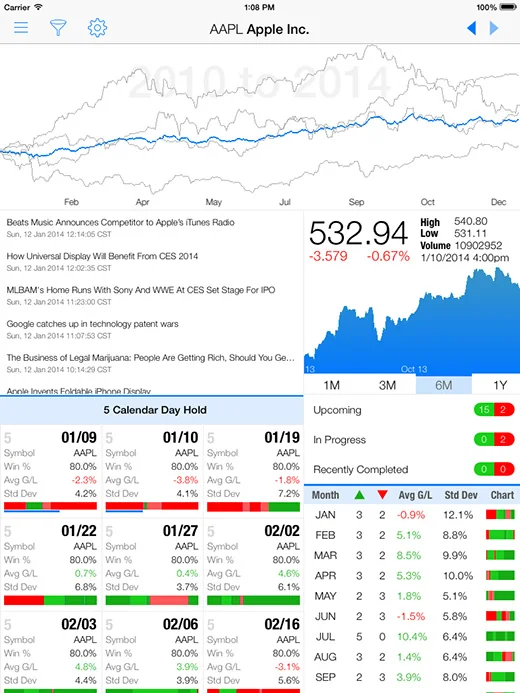
The iPad app used the larger screen for price, news, a seasonality chart, pattern cards, and a monthly summary without hiding the current symbol.
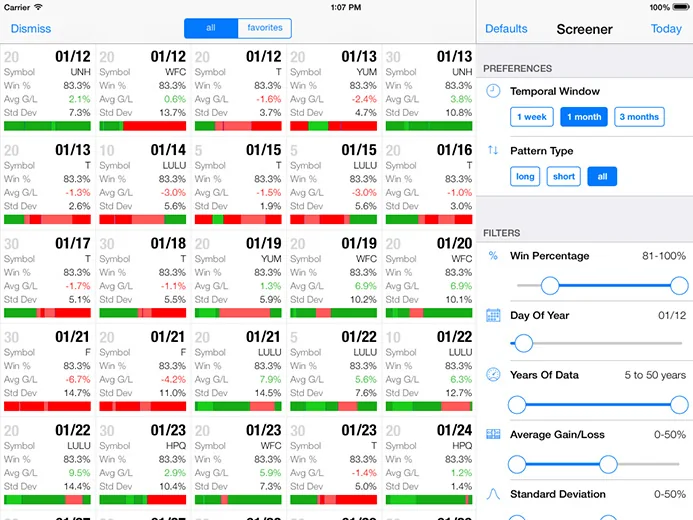
The iPad screener put pattern cards beside temporal, type, win percentage, day-of-year, years-of-data, average-gain, and volatility filters.
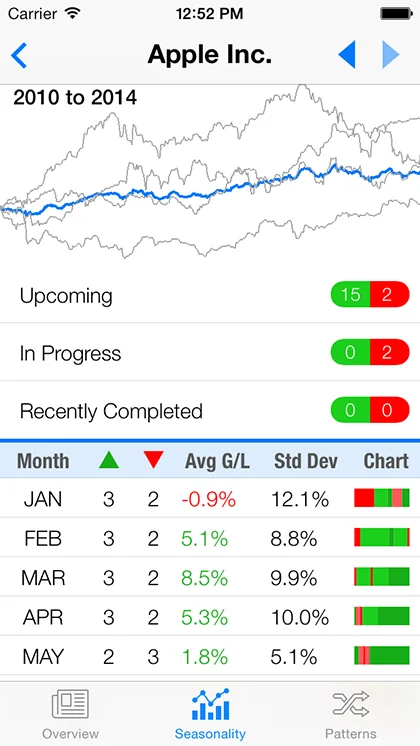
The iPhone view reduced the product to a symbol chart, three pattern states, and a monthly table with win counts, average gain/loss, standard deviation, and chart bars.
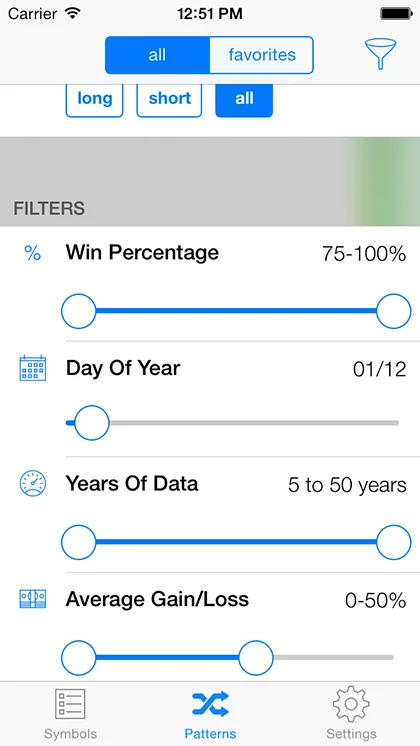
The mobile screen kept screening controls close to the result rows, so date, duration, win percentage, average gain/loss, and history bars could be filtered without leaving the list.
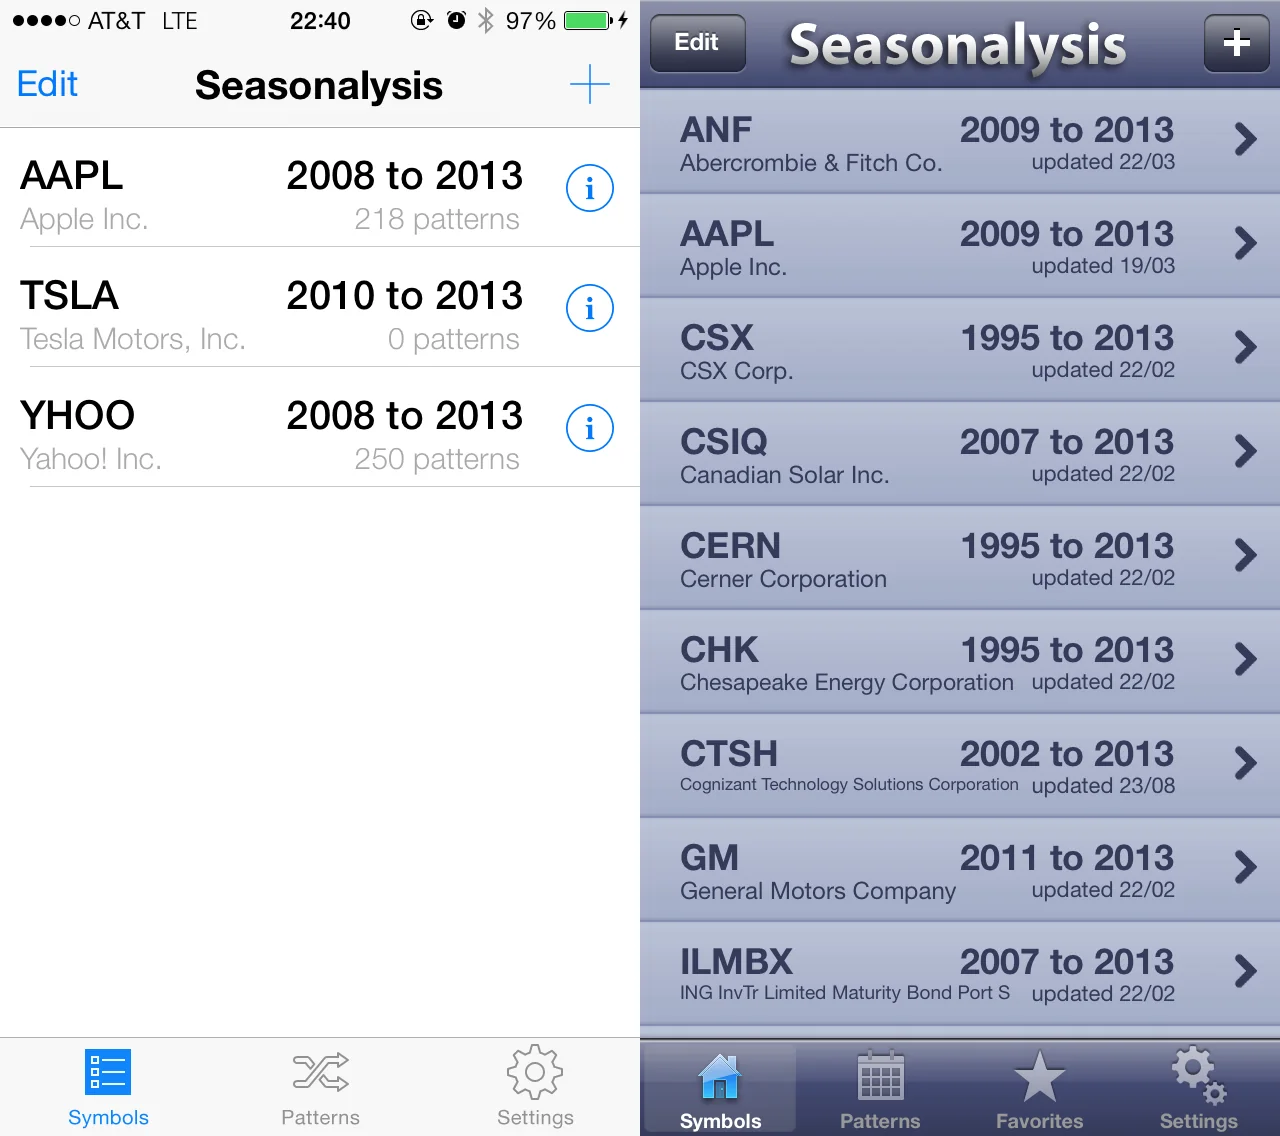
The later iOS surfaces made the saved symbol library more explicit: ticker, company name, date range, update date, pattern count, and detail entry.
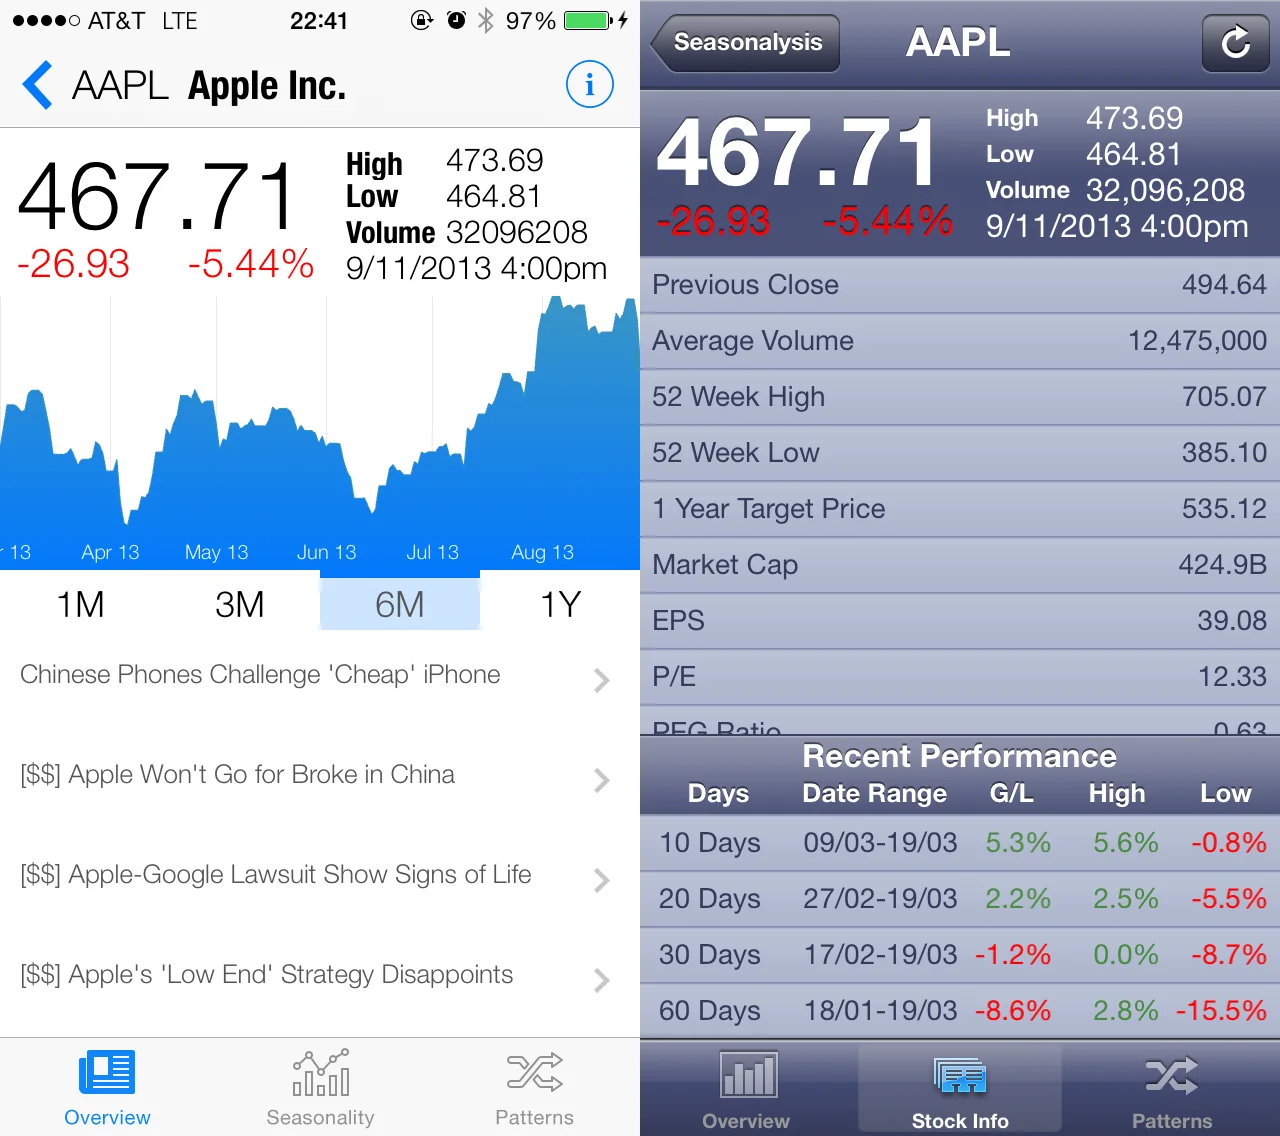
The stock detail views kept quote movement, volume, news, recent performance, and fundamental fields adjacent to seasonal analysis.
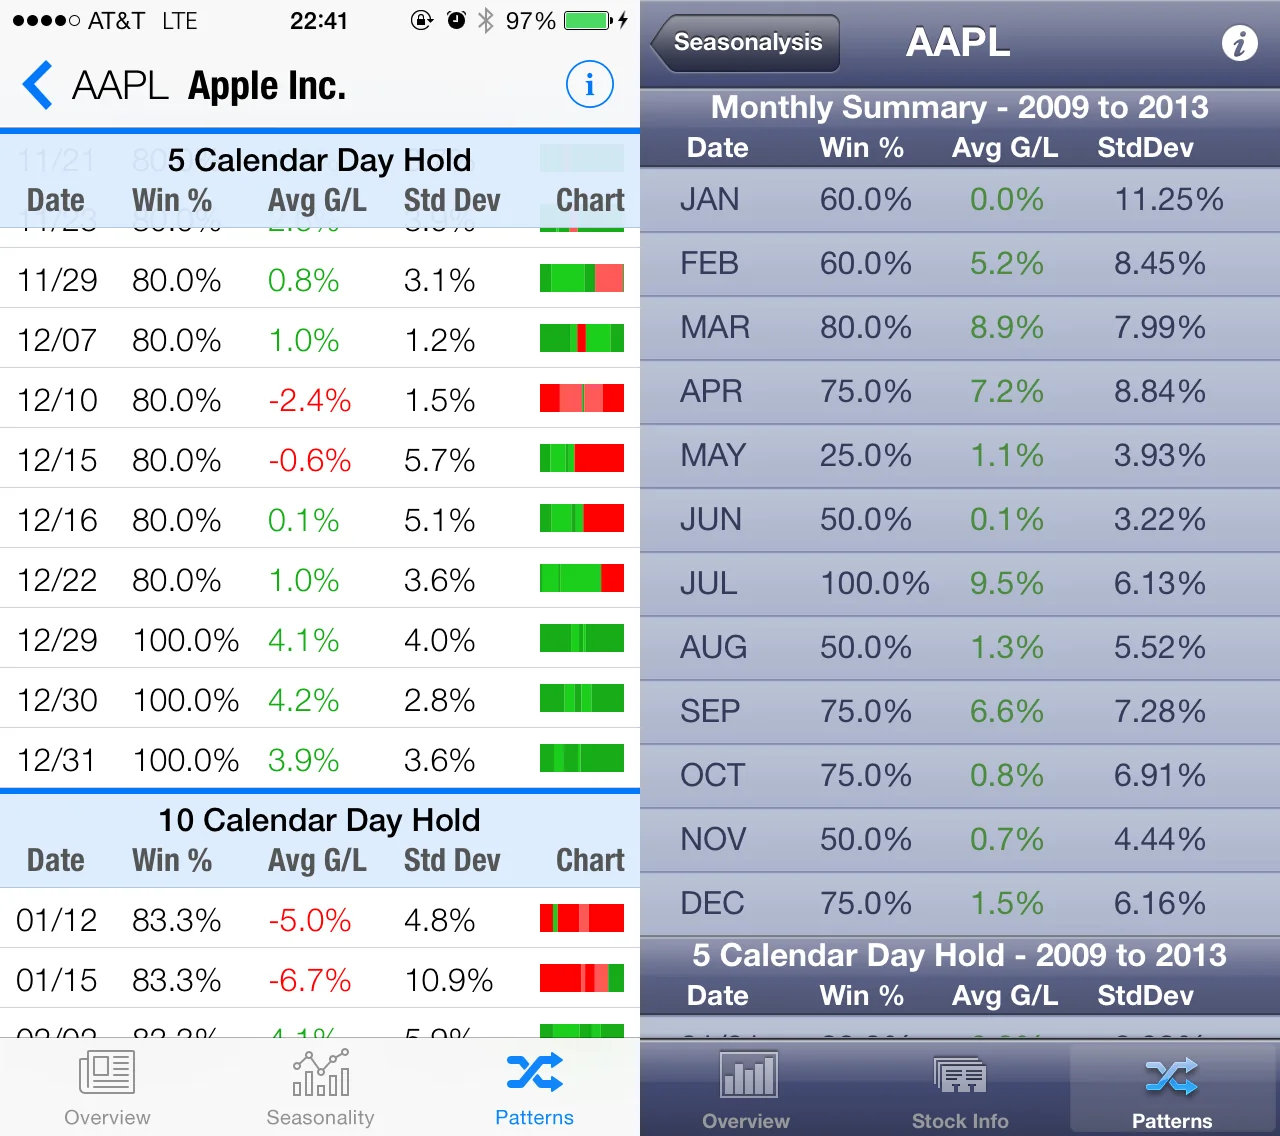
The later pattern views kept monthly summaries and calendar-day hold lists visible, with win percentage, average gain/loss, standard deviation, and chart bars.
Product record
2009
Cyrillian's archive records Seasonalysis as a 2009 iOS app and one of the first 5,000 apps on the App Store. The mobile product centered on symbol lookup, seasonality charts, and pattern screens.
2010
The preserved iPad screens show Apple symbol pages, news, price charts, seasonal graphs, pattern cards, monthly summaries, and filter controls sharing one workspace.
2011
Launched a web version of the iPhone and iPad finance app, with tools for finding and tracking seasonal stock patterns across the entire stock market. The web version was retired in 2018.
Archive index